


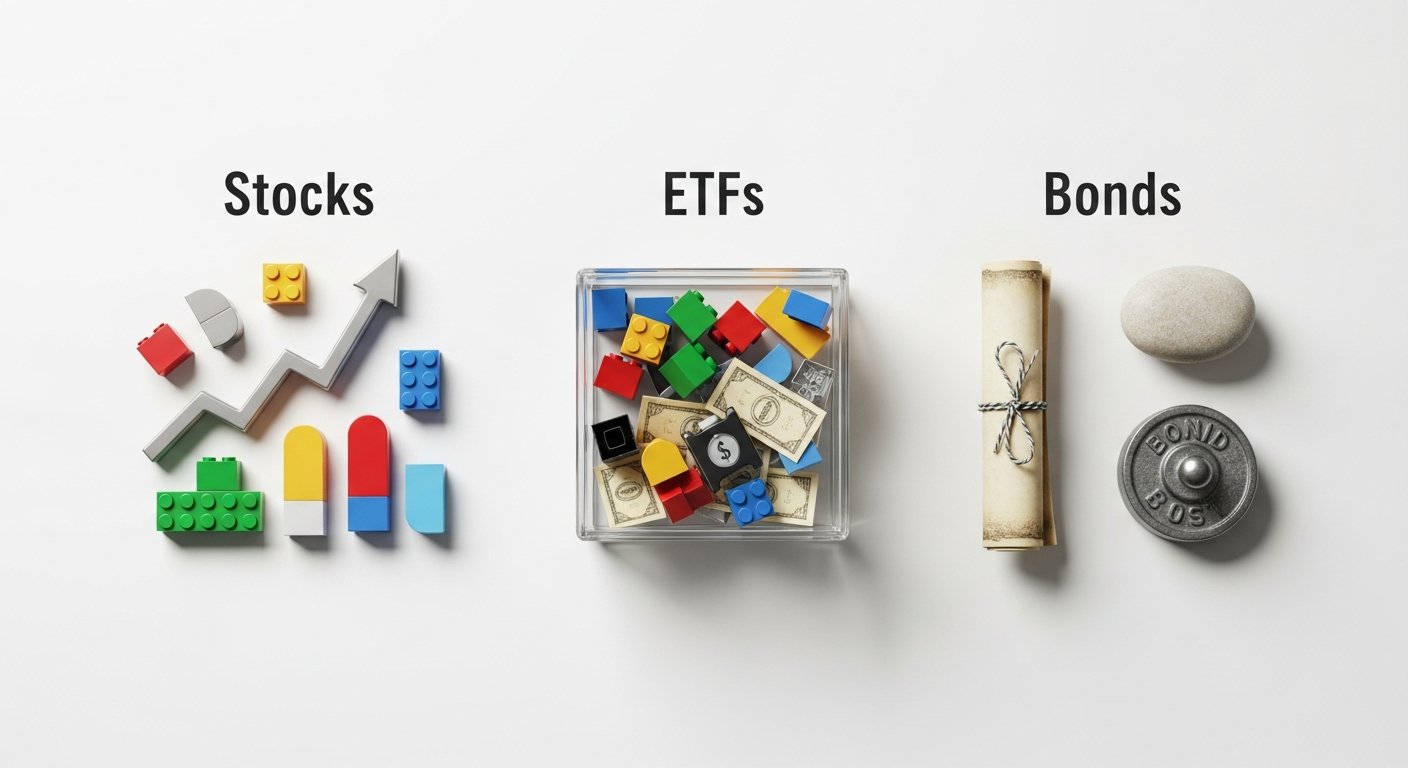
Updated April 2026. If you are starting your wealth-building journey, understanding what are stocks bonds and ETFs is usually the very first step. These three financial instruments form the bedrock of almost every modern portfolio, each serving a distinct purpose in balancing risk, generating income, and driving long-term growth. Navigating the financial landscape can feel overwhelming initially, but understanding these core asset classes allows you to transition from simply saving cash to actively growing your net worth over time.
We will walk through the exact definitions of these investment vehicles, examining how they function in real-world scenarios and why they are essential for your financial future. By stripping away Wall Street jargon, we reveal the straightforward mechanics of corporate ownership, debt lending, and pooled asset diversification. Whether your goal is aggressive growth or capital preservation, mastering these fundamentals provides the clarity needed to make confident, informed financial decisions.
The Mechanics of Equities and Corporate Ownership
Equities represent fractional ownership shares in a publicly traded company. When you purchase these shares, you are buying a proportional claim on that corporation’s assets and future earnings. Historically, broad equity indexes have delivered average annualized returns of approximately 10.2% over the last fifty years, according to Vanguard’s 2026 historical market analysis. This historical outperformance stems from the inherent nature of business growth and economic expansion over extended timelines.
Equity Risk and Potential Returns
Consider a scenario where an investor purchases 50 shares of an emerging cloud software provider. If the company successfully launches a revolutionary new data management platform, its revenue doubles over the next two years. The broader market recognizes this increased profitability, driving the share price up by 65%. The investor benefits directly from this capital appreciation, alongside any potential cash dividends the company chooses to distribute to its shareholders. (Note that companies paying regular dividends are often considered income stocks, whereas those reinvesting profits for expansion are known as growth stocks.)
What is Market Capitalization?
Equities offer higher potential long-term returns because shareholders absorb the primary business risk. In the event of a corporate bankruptcy, equity holders are situated at the bottom of the capital structure, meaning they are paid only after all suppliers, lenders, and debt holders have been made whole. This structural subordination necessitates a higher expected return to compensate investors for the elevated risk profile. Evaluating a company’s total size and valuation requires understanding its Market capitalization, which is simply the total dollar market value of a company’s outstanding shares of stock, calculated by multiplying the current share price by the total number of outstanding shares. To explore how this risk compares to more conservative options, you might look into comparing fixed income against equities for a broader perspective on capital preservation.
How Do Fixed-Income Investments Generate Returns?


Fixed-income instruments function as formal debt agreements issued by governments, municipalities, or corporations seeking to raise capital. When you acquire one of these debt securities, you are acting as the lender. In exchange for your upfront capital, the issuing entity legally commits to paying you regular interest payments and returning the original principal amount on a specific maturity date. U.S. Treasury Department data indicates that the benchmark 10-year yield averaged 4.2% throughout the first quarter of 2026, setting the baseline for global lending rates.
The Mechanics of Debt Securities
The mechanics of these loans provide predictable cash flows. A local municipality might issue a 10-year debt instrument at a 5% Coupon rate (the annual interest rate paid on a bond’s face value) to fund the construction of a new regional hospital. If you lend $5,000, you will receive $250 annually in interest payments. After a decade, assuming the municipality does not default, your initial $5,000 principal is returned in full. This contractual obligation to repay debt provides structural downside protection, making fixed income substantially less volatile than corporate shares.
Interest Rates and Bond Prices
These assets remain crucial for portfolio stability because their price movements frequently exhibit an inverse correlation with equity markets. During periods of severe economic uncertainty, capital traditionally flees from volatile business ownership and seeks the guaranteed repayment structures of government-backed debt, driving fixed-income prices up when shares are falling. However, these instruments are not entirely without risk. As broader economic interest rates rise, the resale value of existing lower-yielding debt on the secondary market drops, requiring investors to hold their assets until maturity to avoid taking a realized capital loss.
[INLINE IMAGE 2: diagram showing the flow of money in a fixed-income investment, illustrating the initial principal loan given to an entity, the annual interest payments returned, and the final principal payout at maturity]
Types of Pooled Investment Products and When to Apply Them
Exchange-traded funds operate as pooled investment vehicles that offer diversified exposure to a basket of underlying assets, but they trade on public exchanges throughout the day exactly like individual corporate shares. Instead of attempting to pick a single winning company, investors use these funds to purchase a broad slice of an entire market sector, geographic region, or asset class in a single transaction. A 2026 Morningstar global fund flow report highlighted that passive index-tracking funds now capture over 82% of all newly invested retail capital, reflecting a massive shift toward simplified, low-cost diversification.
The Efficiency of Passive Indexing
These vehicles are highly efficient due to their underlying structure. Traditional mutual funds rely on teams of highly paid human analysts to actively select investments, whereas most modern exchange-traded options simply use automated algorithms to mirror the performance of an established index, like the S&P 500 or the Nasdaq-100. This passive methodology eliminates massive overhead costs, resulting in a significantly lower Expense ratio (the annual fee that all funds or ETFs charge their shareholders) for the retail investor. Over decades, minimizing these internal administrative fees preserves thousands of dollars in compound growth that would otherwise be lost to management.
Instant Diversification Benefits
Imagine an individual looking to capitalize on the artificial intelligence sector without taking on the extreme risk of a single startup failing. By purchasing shares in a specialized technology-focused fund, their $1,000 investment is instantly distributed across 80 different hardware manufacturers, software developers, and data centers. If one specific hardware company drastically misses its earnings projections and its stock plummets, the negative impact on the investor’s total portfolio is heavily muted by the stable performance of the other 79 companies held within the same basket. This immediate, inherent diversification is the primary mechanism that reduces catastrophic single-point failures in a retail portfolio.
What Are the Key Differences in Risk and Yield?
Distinguishing between these core asset classes requires a clear understanding of their respective risk parameters, expected yields, and functional roles within a broader strategy. Equities drive long-term aggressive growth, fixed income provides steady cash flow and capital preservation, and pooled funds deliver instant diversification across either (or both) categories. According to a 2026 Securities and Exchange Commission (SEC) investor bulletin, utilizing a blended strategy across all three asset types reduces overall portfolio volatility by up to 35% compared to holding a concentrated basket of individual corporate shares.
Comparing Asset Class Profiles
| Asset Type | Primary Function | Typical Risk Level | Income Generation | Inherent Diversification |
|---|---|---|---|---|
| Equities | Aggressive capital appreciation | High | Variable (Dividends) | None (Single Company) |
| Fixed Income | Capital preservation & steady yield | Low to Moderate | Fixed (Interest Payments) | None (Single Issuer) |
| Exchange-Traded Funds | Broad market exposure | Variable (Depends on holdings) | Variable | High (Basket of Assets) |
Liquidity and Market Responses
Their distinct mechanics dictate how they respond to varying economic climates. Equities often struggle during periods of high borrowing costs because corporate profit margins shrink, whereas government debt becomes highly attractive due to rising guaranteed yields. In contrast, evaluating a security’s Liquidity profile—which measures how rapidly you can convert the asset back into spendable cash without severely impacting its market price—determines its flexibility. Publicly traded shares and large-cap ETFs offer near-instantaneous liquidity during trading hours, whereas certain municipal debt instruments might take days to sell at a fair valuation on the secondary market.
Picture a severe global supply chain disruption that causes manufacturing costs to spike overnight. Individual retail and manufacturing shares will likely plummet as profit forecasts are slashed. However, an investor holding a balanced mix of government debt and broad-market funds experiences a much softer blow. The guaranteed interest from their government debt continues uninterrupted, and the broader funds contain sectors—like healthcare or domestic utilities—that are completely insulated from the global supply chain shock. Understanding these tax implications is also a vital component of minimizing capital gains liabilities when rebalancing these diverse assets over time.
[INLINE IMAGE 4: side-by-side visual matrix comparing the risk levels, return potential, and primary functions of equities, fixed-income debt, and exchange-traded funds]
The Science of Asset Allocation for Core Portfolios
Determining the correct mix of these financial instruments—known as asset allocation—is widely considered the single most important decision an investor makes. Strategic allocation dictates over 90% of a portfolio’s long-term performance variation, heavily outweighing the impact of individual security selection or market timing. A 2026 retirement readiness study published by Fidelity Investments demonstrated that individuals maintaining a strict, age-appropriate asset mix are 42% more likely to meet their target withdrawal goals without depleting their principal.
Age-Appropriate Portfolio Structures
Consider two different individuals building their financial futures. A 25-year-old software engineer with four decades until retirement constructs an aggressive portfolio comprising 90% broad-market equity funds and 10% government debt. They can easily withstand severe market downturns because they have decades to recover. Conversely, a 62-year-old preparing to leave the workforce shifts their allocation to 60% high-quality fixed income and 40% dividend-paying equities. This conservative structure ensures that even if the stock market crashes the year they retire, they have enough guaranteed fixed-income cash flow to cover living expenses without selling shares at depressed prices.
The Importance of Rebalancing
Maintaining this balance requires periodic Rebalancing, the process of realigning the weightings of a portfolio of assets to maintain your original target allocation. Because equities typically grow faster than debt instruments over time, a portfolio originally set to a 70/30 split might drift to an 85/15 split after a multi-year bull market, inadvertently exposing the investor to far more risk than they originally intended. By selling off the oversized winners and buying more of the underperforming safe assets, investors systematically enforce a strategy of “buy low, sell high” while maintaining their desired risk parameters. Building confidence in this systemic process is an incredibly effective method for mitigating money-related psychological stress during periods of heightened market turbulence. Additionally, business owners must consider how to house these allocations efficiently, perhaps by exploring options for structuring a self-employed retirement account to maximize tax advantages.
What Are the Most Common Investment Pitfalls?
Even with a solid grasp of core financial instruments, behavioral biases frequently derail long-term wealth accumulation. The temptation to outsmart global markets or react emotionally to short-term news cycles destroys more capital than actual economic recessions. A comprehensive 2025 DALBAR study on investor behavior revealed that the average retail investor underperformed the broader index by 3.1% annually purely due to poorly timed emotional trading. Recognizing and mitigating these psychological traps is essential for preserving compound growth.
Behavioral Biases and Emotional Trading
- Emotional capitulation: Liquidating assets during temporary market corrections locks in permanent losses.
- Ignoring internal costs: Paying high management fees on mutual funds dramatically erodes compound growth over decades.
- Chasing historical performance: Buying sectors simply because they performed well last year often means buying at peak valuations.
Mitigating Concentration Risk
What failure looks like: An investor watches their technology-heavy portfolio drop 22% over three weeks due to an unexpected interest rate hike. Fearful of losing everything, they liquidate their holdings to cash at the absolute bottom of the dip, effectively locking in thousands of dollars in losses, only to watch the market rebound entirely over the next two months while they sit on the sidelines. They then face severe Concentration risk (the potential for significant financial loss due to a lack of diversification) if they attempt to quickly buy back into a single perceived “winning” stock to make up for the realized losses.
What success looks like: The same interest rate hike occurs, and the portfolio drops 22%. The educated investor acknowledges the unrealized paper loss, reviews their long-term asset allocation plan, and does absolutely nothing. They continue automating their bi-weekly contributions into their diversified funds, purchasing new shares at a 22% discount. The causal reality is that markets are naturally cyclical and forward-looking; surviving volatility is the entry fee required to capture historical long-term premiums. Now that you fully grasp what are stocks bonds and ETFs, you possess the structural knowledge necessary to build a resilient, automated financial engine that tunes out the daily noise and systematically compounds wealth.
Sources & References
- Vanguard Group. (2026). “Historical Asset Class Returns and Long-Term Market Averages.” Vanguard Investment Strategy Group.
- U.S. Department of the Treasury. (2026). “Daily Treasury Par Yield Curve Rates.” Treasury.gov.
- Morningstar, Inc. (2026). “Global Fund Flows Report: The Continued Acceleration of Passive Exchange-Traded Vehicles.”
- Securities and Exchange Commission (SEC). (2026). “Investor Bulletin: Asset Allocation and Portfolio Volatility.” Investor.gov.
- DALBAR, Inc. (2025). “Quantitative Analysis of Investor Behavior (QAIB).” DALBAR Financial Services.
Reviewed by Julian Vance, Editorial Director, Digital Finance — Last reviewed: April 15, 2026